Arch 655 Project - Harnessing The Power of Parametric design and Building Information Modeling Through Augmented Reality
Harnessing The Power of Parametric
design and Building Information Modeling Through Augmented Reality
Harnessing The Power of Parametric
design and Building Information Modeling Through Augmented Reality
1
Introduction
This study demonstrates the power and usefulness of
conceptual parametric design in a user-friendly format for students and
professionals. The major goal of this research is to introduce conceptual
parametric design in a simple and engaging way in order to attract students and
young professionals to the parametric design field. The constructive parametric
design technique of the building information modeling (BIM) will convert
the conceptual building massing to building geometry with architectural
attributes. The idea of exploiting BIM's power is to immediately relate
conceptual parametric design to architecture, allowing users to better grasp
the parameter's effects. The conceptual parametric design is a powerful tool
for designers and architects since it allows for live altering and exploration
with little effort. This feature involves the use of complex mathematical
expressions via hard programming [1],
which is one of the most common reasons why architecture students are hesitant
to begin learning and explore the parametric world. Despite the fact that the
new current software makes it a lot easier than previously by adding a visual
scripting interface that does not require any coding knowledge. To achieve the
desired outcomes, any parametric model must have its bases (parameters) changed
or optimized utilizing extra algorithms. Andrea Palladio's nine-square grid was
employed in this study to provide the user the power to pull and push to create
an infinite variety of building designs. The parametric design experience has
been enhanced using augmented reality (AR) technology. By placing the virtual
object in the physical world, AR promotes user engagement and presence in the
experience [2].
The mobile device is the study's target platform, due to its wide AR
accessibility and affordability. The research hypothesis is that combining
parametric design algorithms with augmented reality will allow students to
fully transform the building geometry (translation, rotation, and scaling) and
walk around it in real-world environments, allowing them to explore and
understand their geometrical changes. The study's expected outcome is to
improve the students' understanding of parametric design principles and to
increase their interest in the subject of parametric design.
1.1
Parametric Design
The parametric design form is formed by parameter
values, and equations are employed to define the relationships between the
forms [3].
Modeling with constraints and variable parameters is known as parametric
modeling [4].
As a result, interdependencies between forms can be formed, and their
transformational behavior can be specified (mathematically and geometrically).
Since around 1990, parametric design has had an impact on the evolution of
digital architectural design, with two types: Architectural Conceptual
Parametric Design and Architectural Constructive Parametric Design [1].
1.1.1 Architectural Conceptual Parametric Design
The parameters of a given design are defined in conceptual
parametric design, not its shape [4].
Different objects or configurations can be simply built by setting different
values to the parameters. The parametric and generative representations of
buildings, whether based on orthogonal or curvilinear geometry, are
investigated by Rosenman and Gero, Prousalidou [5].
They are effective because they can capture a large amount of variance in a
small number of numerical values. For parametric design, software like Maya or
Rhinoceros (with Mel or Rhino Script) include script editors. This design
method demands programming or scripting knowledge, and it is a feature of
mathematical algorithms that makes interactive design possible [1].
1.1.2 Architectural Constructive Parametric Design
Data incorporated into a specified 3D model is referred to
as constructive parametric design [3].
CAD products like as Autodesk Revit, Soft Plan, Nemetschek, ArchiCAD, and Chief
Architect implement this parametric approach. Designers can use pre-drawn
components, such as doors, windows, load elements, staircases, and roofs,
instead of drafting lines, arcs, and so on. As a consequence, instead of 2D
drawings, 3D models are produced, which is currently typical in the
shipbuilding sector. The goal of this technique is to minimize drafting time
and 2D drawing adjustments. These software tools were created for standard
architectural elements, however they cannot be used to integrate non-standard
parts of modern digital architecture [6].
1.2
The Grid System's History
In architecture content, one of the meanings of grid is A
regular framework of reference lines to which the dimensions of main structural
components of a building's design are set is known as a structural grid or a
modular grid. The grid is made up of lines that represent a building's
structural, modular, or layout grid, to which measurements are matched [7][00].
The gird system in urban planning is a design of about rectangular blocks
formed by an orthogonal network of streets, often known as a checkerboard plan,
checkerboard plan, chessboard plan, or gridiron plan [8].
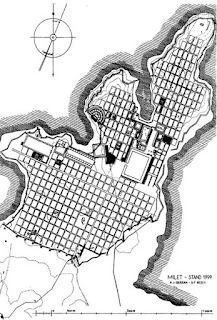
The grid's significance as a statement of societal order and logic is first
articulated in the layout of the Greek city of Miletus (Figure 1.) [9].
Hippodamus of Miletus is the most famous city planner and ruler. We can learn
the most about Miletus from Aristoteles who said "long haired,
extraordinary personality and has ideas about the ideal city" [10].
The grid was drawn from army compound in ancient Roman and was structured
around two main roadways, the Cardo Maximus (north-south) and Decumanus Maximus
(east-west), which were positioned at right angles to each other (figure 2.).
The Forum, or marketplace, the Basilica, or law court, the Curia, or conference
hall, and a Capitolium, or formal state worship, were all located at their
intersection during Hadrian's rule (AD 117-138) [11].
In architecture content, one of the meanings of grid is A
regular framework of reference lines to which the dimensions of main structural
components of a building's design are set is known as a structural grid or a
modular grid. The grid is made up of lines that represent a building's
structural, modular, or layout grid, to which measurements are matched [7][00].
The gird system in urban planning is a design of about rectangular blocks
formed by an orthogonal network of streets, often known as a checkerboard plan,
checkerboard plan, chessboard plan, or gridiron plan [8].
The grid's significance as a statement of societal order and logic is first
articulated in the layout of the Greek city of Miletus (Figure 1.) [9].
Hippodamus of Miletus is the most famous city planner and ruler. We can learn
the most about Miletus from Aristoteles who said "long haired,
extraordinary personality and has ideas about the ideal city" [10].
The grid was drawn from army compound in ancient Roman and was structured
around two main roadways, the Cardo Maximus (north-south) and Decumanus Maximus
(east-west), which were positioned at right angles to each other (figure 2.).
The Forum, or marketplace, the Basilica, or law court, the Curia, or conference
hall, and a Capitolium, or formal state worship, were all located at their
intersection during Hadrian's rule (AD 117-138) [11].
Figure 1. Miletus' layout is built on a rigorous orthogonal grid. Source: Quadralectic
Architecture

Figure 2. Roman Urban Planning.
Source: KMJantz
Jean-Nicolas-Louis Durand made the first concrete attempt in
France to encourage the use of an abstract grid of proportions to coordinate
the plans, sections, and elevations of structures. He was a key player in
Neoclassicism, and his design concept, which used basic modular pieces,
foreshadowed current manufactured construction materials (Figure 3.). He
employed the fundamental architectural meter as the module, which was measured
as the center-to-center distance between columns rather than a column diameter,
which had previously been proportionately tied to the human body [12].
The method of Jean-Nicolas-Louis Durand was popular in Germany among
Neoclassicist architects such as Karl Friedrich Schinkel and Leo von Klenze,
and it inspired Ernst Neufert, a German architect who is best known as an
assistant of Walter Gropius, as a teacher, and as a member of various
standardization organizations, and especially for his essential handbook
Architects' data [13].
In the international style and the Machine era, grids are employed to
coordinate the measurements of a structure and the pieces that are constructed
and assembled in a factory, leaving minimal flexibility for change on site [14].

Figure 3. Durand’s procedure of project composition. Photo: Getty Research
Institute.
1.1
The Gride Method in Architecture
Design
Students are frequently given the traditional nine-square
grid assignment in their first year of architecture school. Palladio's geometry
was drawn from the nine-square grid, since all of his villas were variants of
three bay by three bay arrangements in a nine-square grid (Figure 4.) [15].
Students are encouraged to use their imagination when it comes to adding and
arranging architectural elements, as long as they stay within a nine-square
grid system. It was stated by Timothy Love that this grid format is the optimal
geometric framework for comprehending the link between architectural components
and their spatial features [16].
The grid is similar to language syntax. It's a rigidly defined framework inside
which semantics can take place. Using a grid system like that is beneficial not
just for achieving harmony, but also for conveying design guidelines inside a
layout. Using a grid on a smaller scale allows for internal transformation. On
a larger scale, using a grid allows for the architecture to be extended in a
logical and sensible manner. On a broader scale, employing a grid establishes
the ground rules for prospective building linkages. All of this takes place on
two levels: structural and spatial planning. The above can be accomplished by
using a simple grid that follows the golden rectangle's rules. That isn't to
claim that it is the only way to design a building. John Habraken's tartan grid
provides a high level of flexibility, bridging the gap between space
utilization and physical limitations [8].

Figure 4. Schematized plans of Palladio’s villas. Source: Wittkower 1949.
1.1
Augmented Reality
The Oxford Dictionary defines the word 'augment' as 'to make
something greater by adding to it.' Making greater may be defined as enlarging,
expanding, or enhancing the properties of physical components. Augmented
reality (AR) is the use of digital components to enhance a physical
experience. To improve people's perception, AR employs a number of digital
components in the realms of hearing, sight, touch, and aroma [2].
AR is a type of computer-generated information that is placed on the real
world. Our surroundings have been enhanced to make it easier for users to
fulfill their tasks [17].
The environment in AR is real, but it has been supplemented with system data
and images [18].
AR improves the physical world and is constructed on top of reality, rather
than being limited to virtual scenes [19].
When the natural world is virtual and the artificial environment improves it
with real goods, this is known as augmented virtuality (AV).
According to augmented reality practitioners, the need for
more comfortable and affordable living standards makes the inclusion of AR into
our lives inescapable. AR is a virtual component that augments the real
world to provide users with additional digital knowledge and capabilities. The
most relevant digital content would be displayed at the appropriate time and in
the right place via augmented reality. The content might be added to the real
environment, and AR allows for the transformation of existing objects in such a
way that users can't identify the difference between them and the real thing [17], [20]
. According to Azuma the three essential components of AR are [19], [21]:
·
The fusion of real and
virtual objects
·
Real-time interactivity
·
The alignment of both real
and virtual objects
The concept of a "virtuality continuum" relates to
the mix of object classes presented in any particular display situation, as
described in Figure 5., where genuine environments are displayed on one end and
virtual environments on the other. The first scenario, shown on the left,
relates to environments formed completely of real objects, such as those shown
on a typical television display of a real-world scene. Another example is
firsthand observation of the same natural phenomenon without the aid of any
electronic display technology. The right-hand instance denotes settings made
entirely of virtual objects, such as a traditional computer visual simulation.
The simplest way to view a Mixed Reality environment, as illustrated in the
diagram, is one in which real and virtual world things are exhibited
concurrently on a single display, that is, anywhere between the virtuality
continuum's extremes [20].
 Figure 5. Virtuality Continuum (Milgram, P., & Kishino, F. 1994)
2 Method
2 Method
Figure 6. Research Methodology Graph
2.1 Creating Parametric Model
The parametric model has started with nine grid layout 6m * 6m which will carry nine boxes (figure 7.). The dismission of the grid is based on ten times human scale which is 60cm according to Architects' Data Book by Ernst Neufert. The internal points of gride five have selected to guide the boxes placement and movement (figure 8.). In the parametric definition each point is responsible to hold grid five and two adjacent boxes. The boxes have the ability to move in X,Y,Z but, not all pf them are able to move in the three axis. The gride five is only move in the Z axis to control the height, and X,Y are fixed to simplify the process in term of the movement direction. However, the courtyard design can be achieved by removing the box in grid five. Any box in any grid can be removed by setting the height (Z) equal zero. The middle grids (2,4,6, and 8) are attached to the fifth grid from the back, and they only can move on the X or Y axis depends on the box location (Figure 9.). The corner grids move on the X and Y axis. The placement and movement organization and removing the unwanted box logic has implemented in one algorithm (figure 10.). Each box has separate number sliders to control the allowed movements either on the X or Y or Z axis (figure 11.).
Figure 7. Nine gride layout

Figure 8. Grid five’s points

Figure 9. Middle grids movement

Figure 10. The main placement and movement organization and removing algorithm

Figure 11. Boxes control.
1.1
Converting to BIM Model
In the project, the VisualARQ (VA) BIM plug-in for grasshopper
has been utilized to convert the original boxes to BIM component then to a
building. The wall component in VA is based on a curve input, thus the curve must
be extracted from the original shape composition. I did extract the initial shape’s
curves into two sets the boundary line and the interior to generate the walls (figure
12.). The idea of separating the boundary curve form the rest is to use it to
place the windows and doors. I have created three points on the boundary curve
each point representing the position of an architectural component (figure 13.).
By implementing an if statement to the point, the position of the point will correspond
to the geometry walls list to pick the wall that has the placement guild point
onto to be the host wall for the window or door. Each component have a set of
sizing parameters (figure 14.)

Figure 12. Walls’s curve extraction

Figure 13. Points on the boundary curve

Comments
Post a Comment